
Market-analysis workspace · Binance Spot and USD-M Futures · Private AlphaMarket-analysis workspace · Private Alpha
The market beneath the candle.
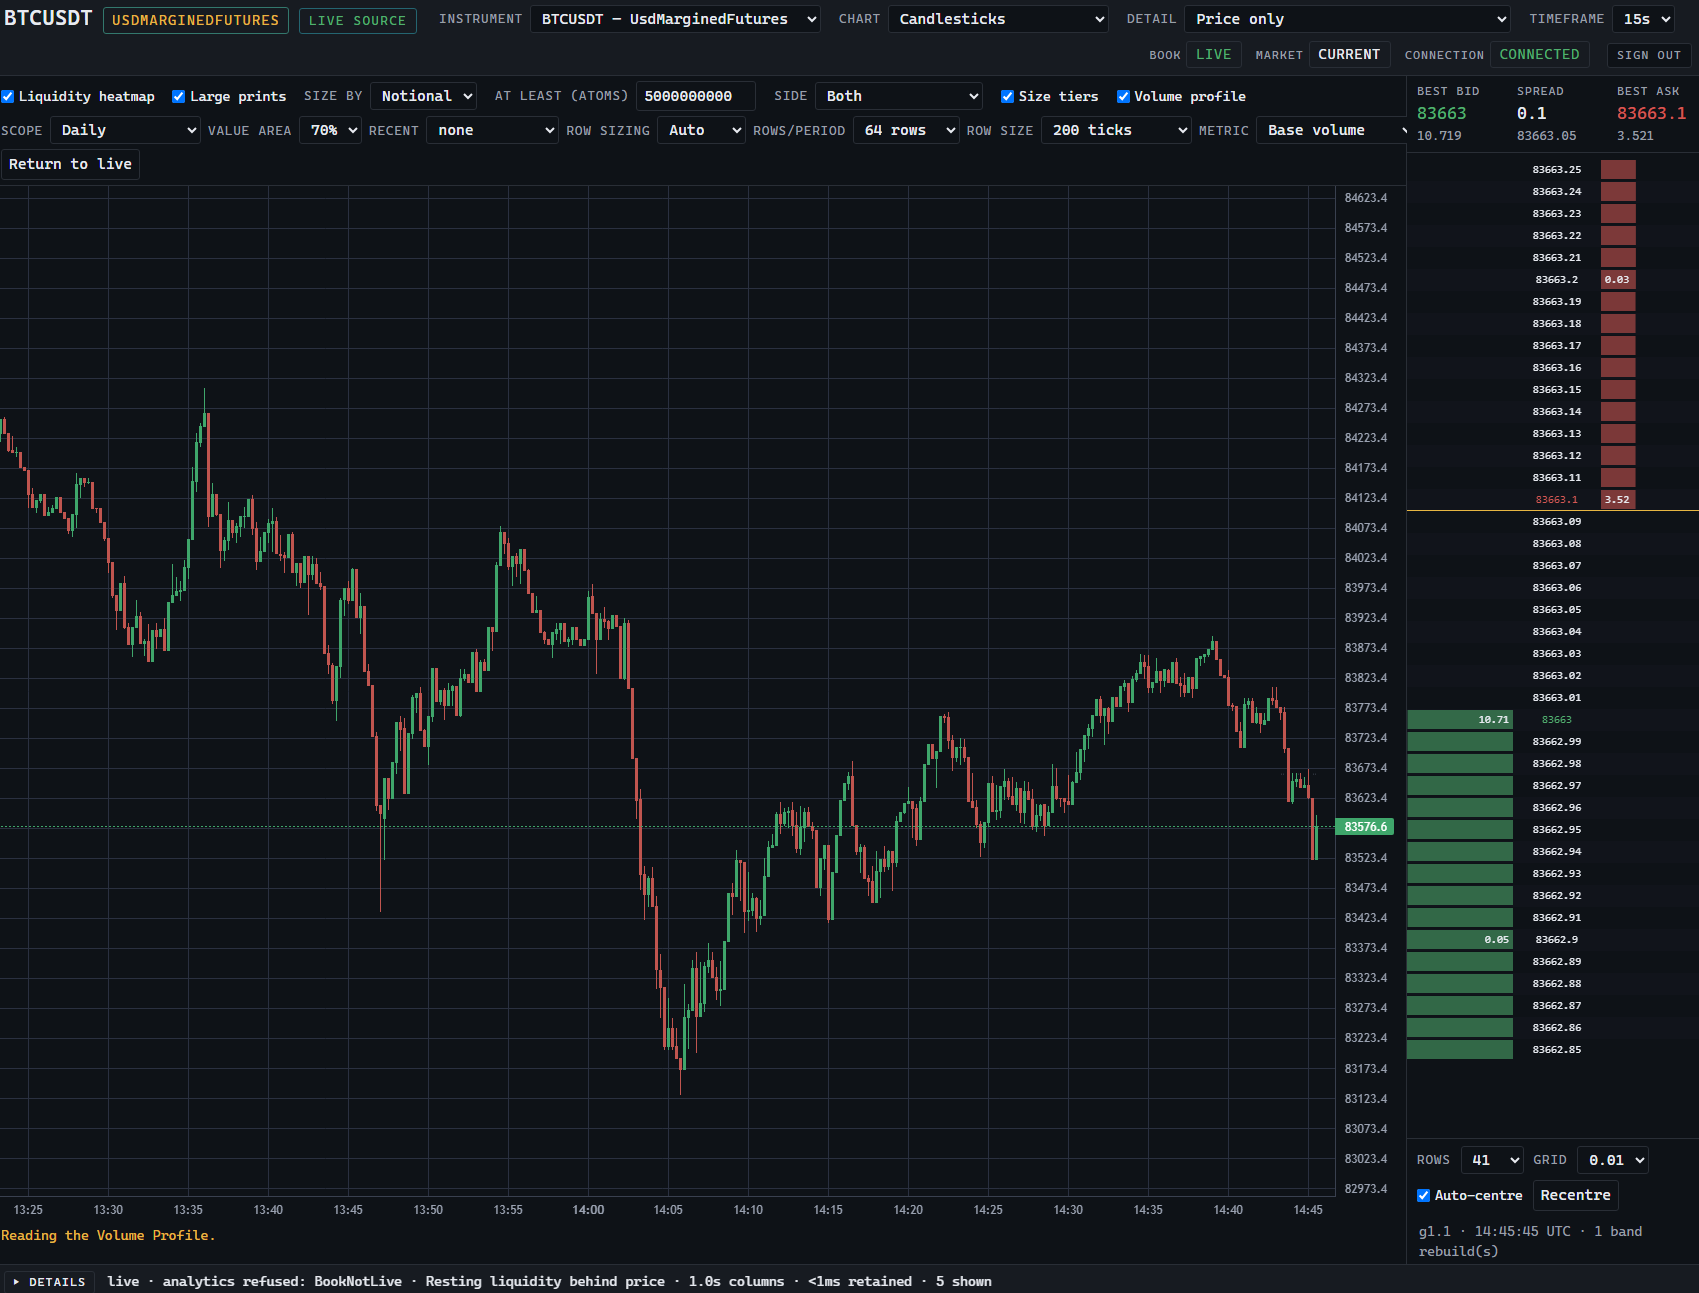
Market structure
Four layers. One price axis.
Price is the surface. Beneath it: where volume was accepted, what actually traded, and what is resting in the book. Each layer is a separate measurement of the same market, read top to bottom.Price is the surface. Read down through value, executed flow and resting liquidity.
-
01 Price
Candlesticks. Open, high, low, close per interval. The familiar surface.
Surface -
02 Value
Volume by price. Where the market accepted price and traded.
- VAH
- 83,820
- POC
- 83,760
- VAL
- 83,690
-
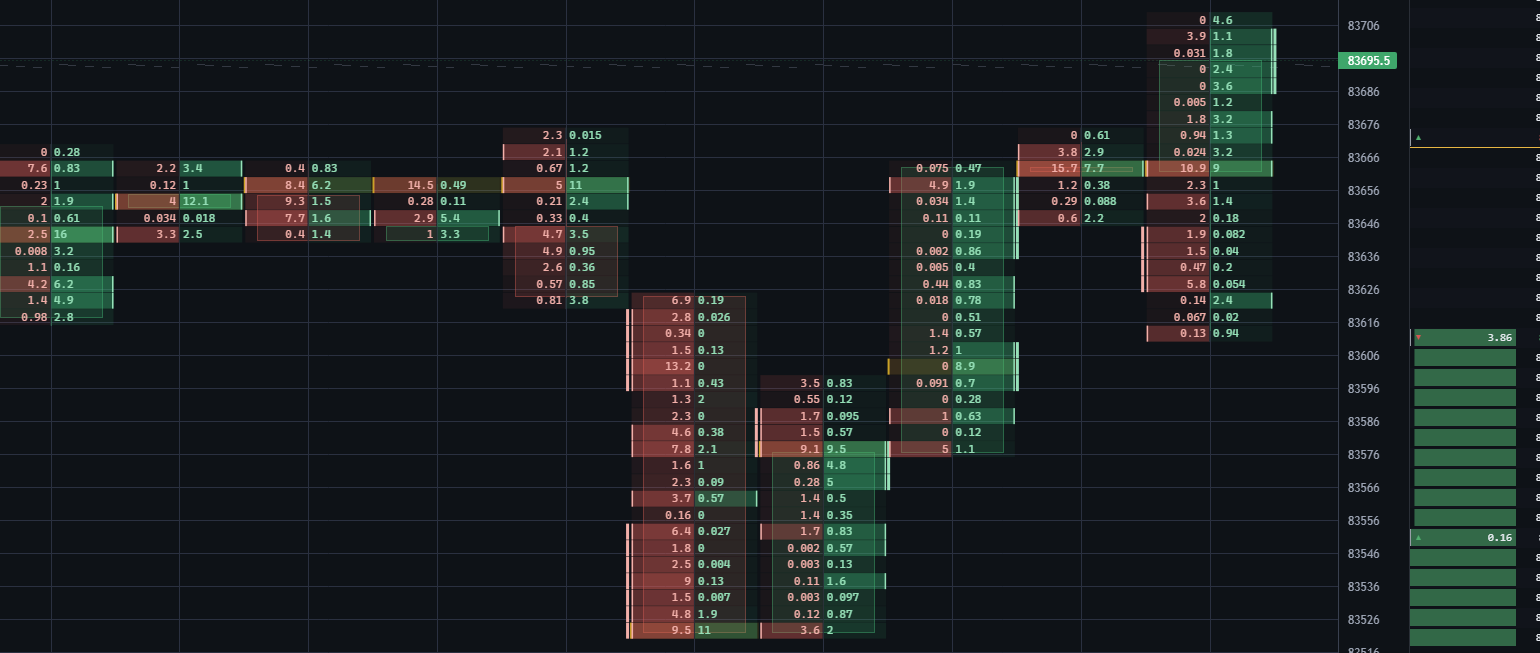
03 Executed flow
Trades that happened, split bid × ask per price level.
-
04 Resting liquidity
Orders waiting in the book, by price and over time.
Deepest layer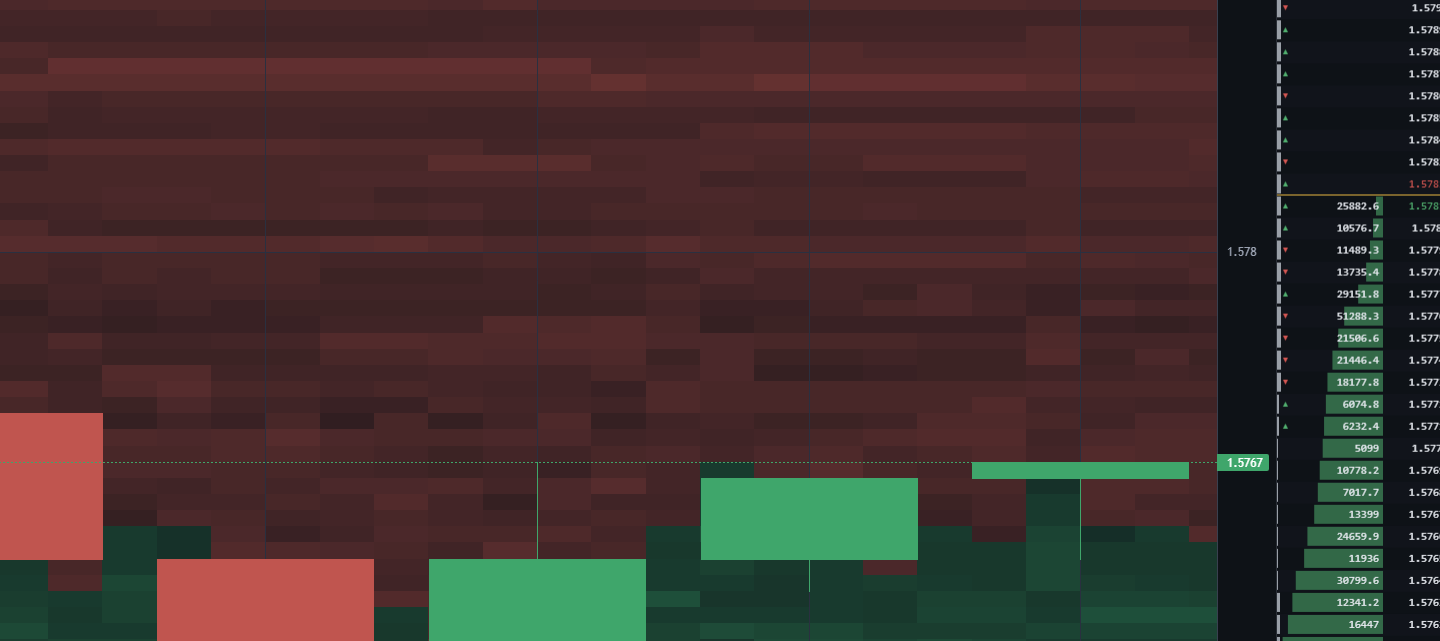
01 · 03 · 04 production screenshots · unaltered crops02 sample data · illustrative
01 · 03 · 04 production screenshots · 02 sample data
02 · Value · Volume Profile
Where the market accepted price.
Volume Profile shows participation by price. The point of control is the highest-volume level. The value area holds 70% of session volume between VAH and VAL. Measurements of the session, not targets.POC is the highest-volume level. The value area holds 70% of session volume.
Sample data · illustrative composition
- VAH
- 83,820
- POC
- 83,760
- VAL
- 83,690
03 · Executed flow · Bid × Ask footprint · Large prints03 · Executed flow · Footprint
What actually traded, per price level.
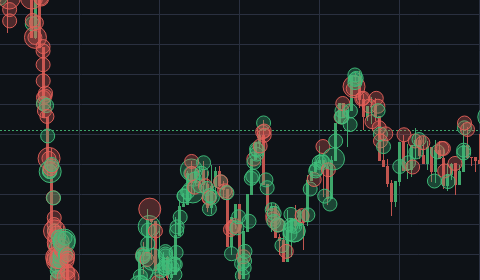
Every bar opens into its footprint: aggressive selling against aggressive buying at each price. Imbalance and absorption are marked on the cell. Large prints are drawn where they executed, sized by notional.Aggressive selling against aggressive buying at each price. Imbalance and absorption marked on the cell.
Reading a cell
- Bid
- Aggressive sell volume at the price
- Ask
- Aggressive buy volume at the price
- Imbalance
- Diagonal bid × ask ratio ≥ 300%, dominant side filled
- Absorption
- Heavy execution without price progress
- Stack
- 3 consecutive imbalanced rows
Bid · sellAsk · buyImbalance ≥300%Absorption
BTCUSDT·USD-M FuturesSnapshot
04 · Resting liquidity · Level 2 · DOM · Heatmap04 · Resting liquidity · Heatmap
What is waiting to trade, around price.
The deepest layer. Resting orders across the book, drawn as a ladder and as a heatmap over time: where size sits, where it replenishes, where it disappears.Resting size behind price, over time. Brightness is size. Bid depth below, ask depth above.
Level 2 ladder
Full-depth DOM with best bid, best ask and spread. Size per level, updated from the venue's depth stream.
Liquidity heatmap
Resting size behind price, over time. Brightness is size. Levels that vanish before price arrives are visible as gaps.
Book state
Every ladder and heatmap carries its book continuity state. When the book cannot be trusted, depth analytics are withheld.
Markets
Same instrument. Separate market truth.
Binance Spot and Binance USD-M Futures are distinct books with distinct flow and distinct integrity guarantees. The workspace analyses each on its own and never merges them into one feed.
Binance Spot
Spot- Order book
- Own Level 2 stream · own DOM · own heatmap
- Executed flow
- Own trades · own footprint · own large prints
- Value
- Profile computed from Spot volume only
- Book continuity
- Verifiable when intactSequence-verified while coverage holds; fails closed on a gap
Own book, own trades, own profile.
ContinuityVerifiable when intact
Binance USD-M Futures
USD-M- Order book
- Own Level 2 stream · own DOM · own heatmap
- Executed flow
- Own trades · own footprint · own large prints
- Value
- Profile computed from Futures volume only
- Book continuity
- Unproven by designNot provable from source semantics; stated on every panel
Own book, own trades, own profile.
ContinuityUnproven by design
Current production universe
5 instruments × 2 venues · 10 separate markets- BTCSpot · USD-M
- ETHSpot · USD-M
- SOLSpot · USD-M
- LINKSpot · USD-M
- XRPSpot · USD-M
USDT-quoted. Additional instruments meet the same integrity requirements before they are added.
Current universe · 5 × 2 venues
- BTCSpot·USD-M
- ETHSpot·USD-M
- SOLSpot·USD-M
- LINKSpot·USD-M
- XRPSpot·USD-M
Data integrity
When continuity cannot be proven, the platform says so.
Every analytical panel carries a data-trust state. Missing depth is not interpolated. Gaps are drawn as gaps. Analytics that depend on an unproven book are withheld rather than estimated.Missing depth is not interpolated. Gaps are drawn as gaps. Dependent analytics are withheld, not estimated.
- No fabricated continuity.
- No interpolated gaps.
- Absence renders as absence: —
Data-trust states
Shown on every panel- Trusted
- Sequence continuity verified for the range in view.Continuity verified. All analytics available.
- All analytics available.
- Partial
- Coverage is incomplete for part of the range.Coverage incomplete. Limitation stated on the panel.
- Values shown with the limitation stated on the panel.
- Unavailable
- No data for this instrument, venue or period.No data. Rendered as —.
- Rendered as —. Nothing is estimated.
- Continuity unproven
- The book sequence cannot be reconciled, or the venue provides no provable sequence.Book sequence not provable. Depth analytics withheld.
- Depth-dependent analytics are withheld. USD-M depth carries this state by design.
Access is by invitation.
Ecosystem Trading is operating in Private Alpha. There is no public signup. Participants receive an invitation and sign in to the workspace.No public signup. Participants receive an invitation and sign in to the workspace.